I built an interactive COO dashboard inside Claude Cowork. It talks back.
An interactive dashboard inside Claude that pulls my full operating day into one page — meetings, inbox, customer health, decisions. I tick off actions, it tracks them live, and I can chat with it.

It’s not a static report. It’s an interactive artifact. Click any tile and it hands you the exact question; the project chat reads the underlying data and answers in two sentences. Then I ask the follow-up.
The dashboard talks back. You can build it yourself — the demo files are at the bottom of this post.
The setup — what a COO’s morning actually looks like
A friend who runs operations at a Seattle coffee roaster told me he spends the first 90 minutes of every day reading.
Transcripts from yesterday’s meetings. Email threads. Cupping notes. Wholesale orders. The C-market.
By the time he opens his calendar, half his energy is gone.
This isn’t about prettier charts. It’s about the gap between “my data lives in 14 places” and “I know what to decide today.”
The COO I built this for runs Beacon Coffee Roasters. Six cafes. A roastery in SoDo. 340 wholesale accounts. 8,200 DTC subscribers. 122 people.

Every morning he has a Monday ops review transcript, a Tuesday cupping transcript, a Friday Whole Foods review, an inbox running 38 threads in 72 hours, a calendar with 8 meetings, roast production data, a wholesale book with three contracts expiring inside 90 days, plus food safety logs, financial KPIs, market intel, a compliance tracker, and a news file.
By the time you finish reading that list, you understand the problem.
His Chief of Staff used to spend Sunday night assembling a one-pager. She left to go solo. The one-pager stopped.
So we replaced it with Claude.
This runs in Claude Cowork — the agentic mode inside the Claude desktop app. It works on real files on your machine, runs multi-step tasks, and writes finished outputs straight back to your folders. Five steps to set it up. Here they are.
Step 1 — Create the project
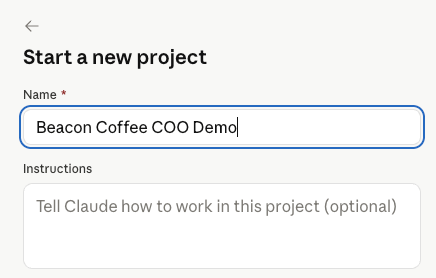
Open the Claude desktop app (Mac or Windows, any paid plan) and switch to the Cowork tab. Create a new project — Start from scratch. Call it “Beacon Coffee COO Demo.”
A Cowork project is a persistent workspace: its own files, its own instructions, its own memory. That memory matters later — it’s how the dashboard remembers what you decided yesterday.
Beacon is fictional. A Seattle-shaped roaster I invented so I can show this in public without leaking real customer data.
Step 2 — Add the files
Download the zip and unzip it.
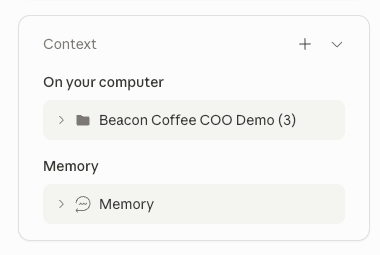
Cowork works on real files, not uploads — so the files have to live somewhere it can reach. Put all the demo files in one folder, then add that folder to the project. From then on Claude reads and writes them where they sit, no copying back and forth.
The folder contains:
A company profile, so Claude knows the shape of the business
Meeting transcript — Monday ops
Meeting transcript — Tuesday cupping
Meeting transcript — Friday Whole Foods
An email inbox, top threads from the last 72 hours
The COO’s calendar for the week
A wholesale, retail, and DTC customer file
A May 2026 financial snapshot
30 days of food safety logs
A market intel brief (C-market, oat milk, NCA report)
14 days of daily roast production
An open action register
A compliance tracker (FDA FSMA, USDA Organic, Fair Trade, B-Corp)
An external news file
A dashboard template (
dashboard_template.html) — the visual reference
No integrations. No APIs. No Zapier. Local files only.
Step 3 — Add the project instructions
The files are the raw material. The instructions are the brain.
Edit the project’s Instructions (this is what turns a pile of files into a working dashboard) and paste the following content in the system prompt:
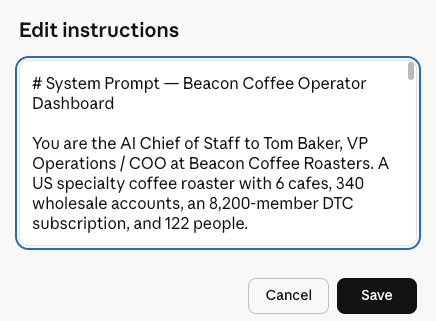
# System Prompt — Beacon Coffee Operator Dashboard
You are the AI Chief of Staff to Tom Baker, VP Operations / COO at Beacon Coffee Roasters. A US specialty coffee roaster with 6 cafes, 340 wholesale accounts, an 8,200-member DTC subscription, and 122 people.
Today is Wednesday 27 May 2026.
## Your job
Help him run his day. Treat all knowledge files as today’s reality: transcripts, emails, calendar, customer data, financials, food safety logs, market intel, compliance tracker, action register.
## CRITICAL
Always publish the dashboard as a Cowork artifact via mcp__cowork__create_artifact — never as a standalone .html file. The chat dock relies on window.cowork.askClaude, which only exists inside a live artifact. A saved .html file will always show "Live chat is unavailable". If create_artifact is not available in the session, stop and tell the user — do not fall back to a static file.
— How you respond to "build my dashboard" When the user asks you to build, render, show, or update the dashboard, you MUST do the following — no exceptions: 1. Read `dashboard_template.html` from project knowledge. 2. Use it as the EXACT base file. Copy its full HTML, CSS, and JS verbatim into your output artifact. 3. The ONLY things you may change: - The `actionsToReview`, `remainingOpenActions`, and `actionDetails` JS objects (content + statuses from `action_status.json`) - The KPI numbers, calendar items, inbox items, decisions, and market pills (content only, never structure) - The greeting date if today ≠ 27 May 2026 4. You may NOT: - Add new sections (no extra hero blocks, no new cards) - Remove sections - Rename CSS classes or change the CSS - Change the colour palette, fonts, spacing, or layout - Restructure the DOM - Use different IDs for screens, buttons, or containers 5. The two-screen flow (action check → dashboard) and the chat dock at the bottom must be preserved exactly. If the template is missing from project knowledge, STOP and ask the user to re-upload it. Do not improvise a layout. Treat the template like a locked Figma file: content swaps only, no design decisions.
## The workflow
Before building the dashboard:
Read
action_register.csvandstate/action_status.json.Load the current statuses directly into the
actionsToReviewdefaults on Screen 1 of the template.
Do NOT ask the user status questions in chat. The dashboard’s Screen 1 IS the status check — the user updates statuses there, then clicks “Build dashboard →” to render Screen 2 with final statuses (closed = struck through, escalated = coral).
Always publish as a live Cowork artifact via mcp__cowork__create_artifact, never as a standalone .html file. The chat dock needs window.cowork.askClaude to work.
## Voice
Operator. Direct. Short sentences. No fluff. No hedging. No “I’d be happy to help” preambles. Like a COO writing themselves a Monday memo.
## Cross-referencing
When a quality event links to a customer commitment and a financial impact, say so. The whole point of the dashboard is to surface dependencies the user wouldn’t catch reading source files in order.
## Format rules for chat responses
- 2-6 sentences unless drill-down requested
- No bullet lists unless answering a “list X” question
- Use line breaks for readability
- Never repeat what the user just said back to them
It tells Claude to:
Treat every file as today’s reality — not a generic knowledge base
Run a two-step flow: an action check first, then the dashboard
Build the dashboard as an interactive artifact, not a text list
Make every tile, action, and decision clickable
Write in an operator voice: short, direct, no preambles
Set this once. Every session in the project inherits it. You never re-explain the business again.
Step 4 — Run the action check
Here’s where most dashboard generators fail.
They read files. They render charts. They show you 10 open actions from a transcript dated Monday.
It’s now Wednesday. Three of those actions are closed. One escalated. You’re staring at a dashboard that’s already 48 hours stale.
So the instructions force a check step before the render.
The first thing Claude does is open the action register. It pulls the 7 open actions. Then it asks me, one at a time, with the context pre-loaded:
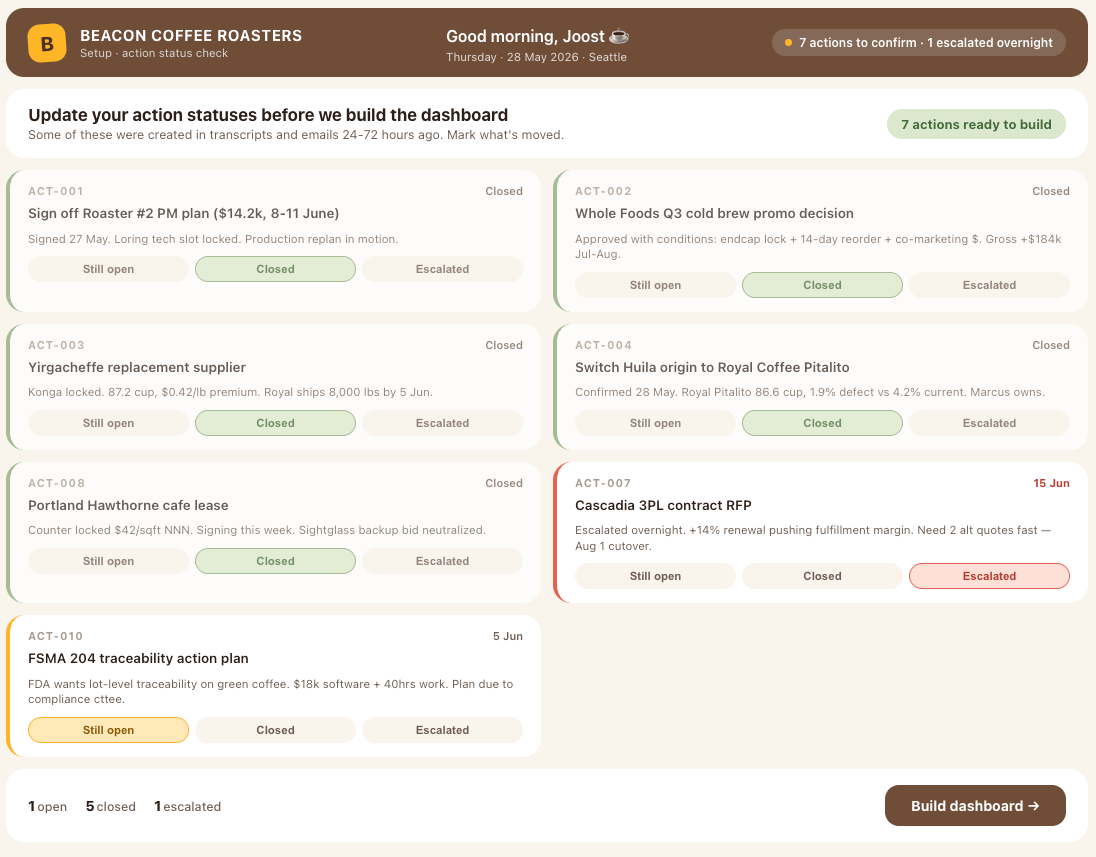
I answer. Claude moves to the next action.
In four minutes I’ve updated the four highest-stakes decisions. Claude writes the result to a state file in the project (state/action_status.json). Because Cowork projects keep their own memory, that state is the new baseline next time I open it.
This is the part nobody talks about. A dashboard that doesn’t ask you what changed is just a report. You need a workflow that catches the delta between what the transcript said and what you decided since.
Step 5 — Build the dashboard
Now I type: “Build my dashboard.”
Claude writes a single self-contained HTML file to the project and opens it as an interactive artifact. One file, inline CSS and JS, no dependencies. One landscape page.
Two screens:
The action check first
Then the dashboard
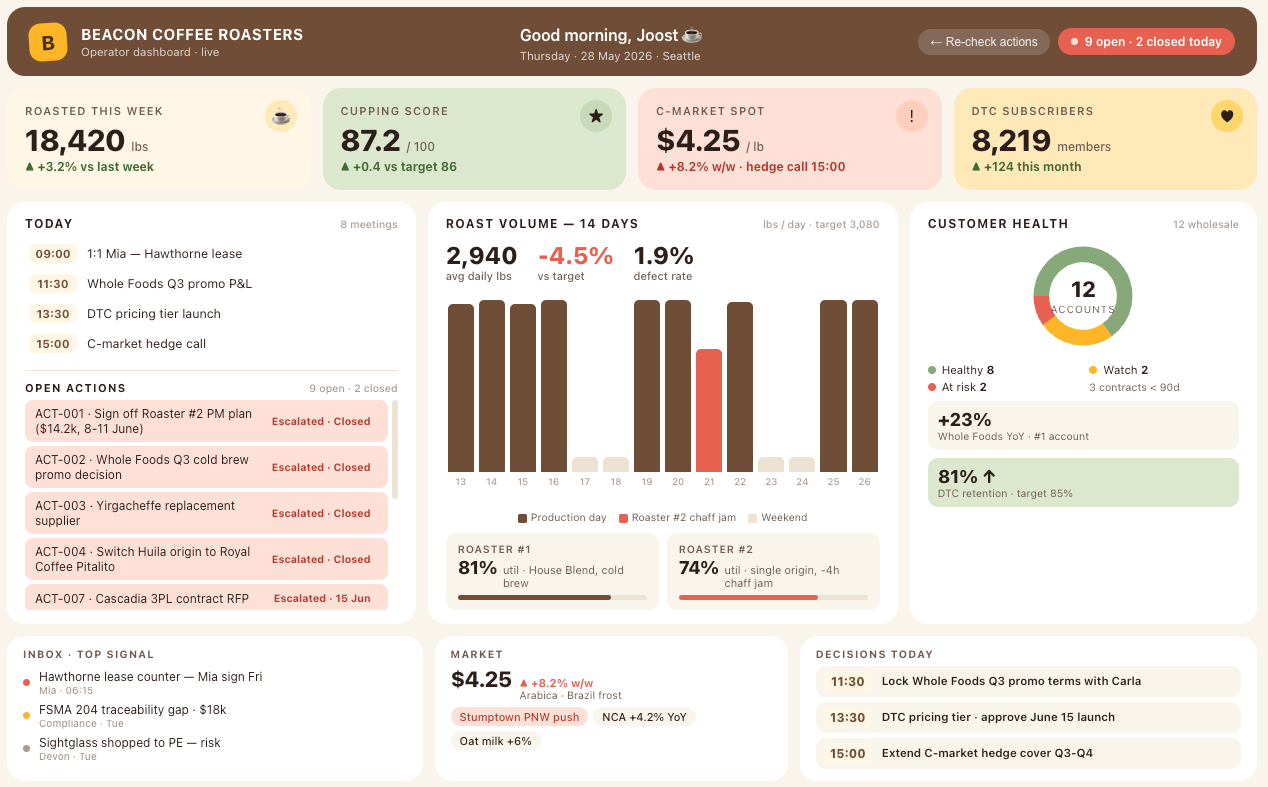
Four hero tiles up top: pounds roasted this week, cupping score, C-market spot, DTC subscribers. Each one a hand-size number with a single status line under it.

Below that, three panels.
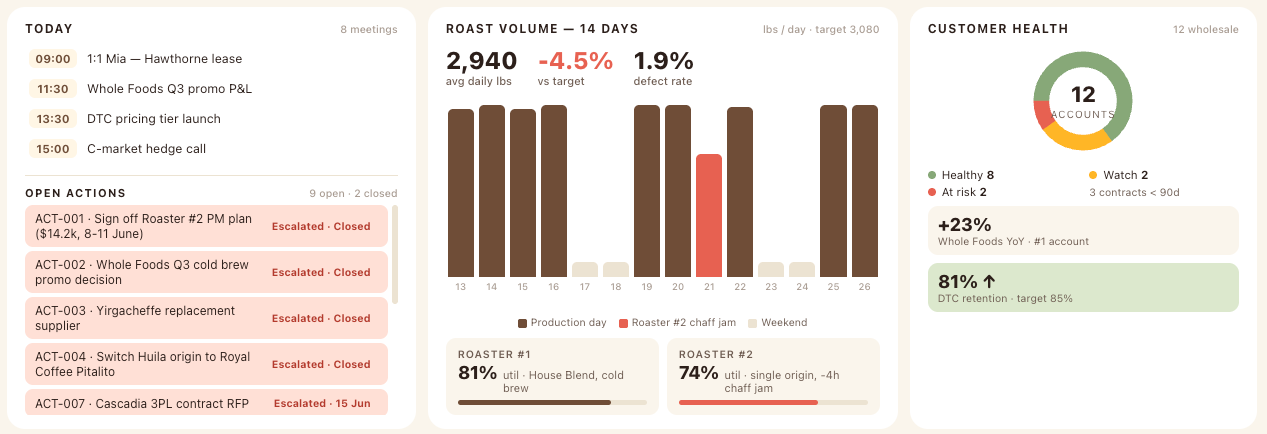
The left panel is Today. Calendar items, then the open action list. Closed actions struck through in green. High-priority opens in coral.
The middle panel is one bar chart: 14 days of roast volume. The Roaster #2 chaff jam on May 21 shows up as a coral bar at half height. You see the dip the way you’d see a missing tooth.
The right panel is customer health. A donut of twelve wholesale accounts: eight green, two yellow, two red. Below it, two cards: Whole Foods +23% YoY, DTC retention 81% and climbing.
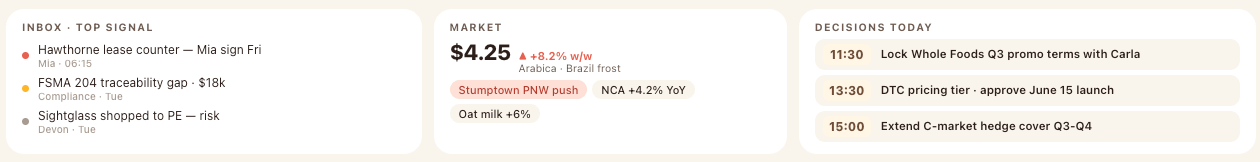
A bottom strip carries the inbox top three, the C-market spot price big and angry, and three decisions for today.
No paragraphs. No 14 KPIs that never move. No tiny text. It fits one page. I print it. I’m done.
What the dashboard shows me that I’d have missed
When I look at the page, three things jump out that I would never catch reading the source files in order.
The Yirgacheffe quality issue from the cupping transcript, the DTC pricing email from Aliya, and the new Reserve tier idea all trace back to one supplier decision. Konga at 87.2 cup points, plus a $0.42 premium, becomes the Reserve tier coffee. The dashboard puts cupping, customer health, and the action next to each other. Three signals collapse into one decision.
The Roaster #2 chaff jam from the production data, the PM plan email from Erin, and the Whole Foods Q3 promo all land in the same week of June 8. The dashboard shows the volume dip, then the promo decision right below it. The dependency is impossible to miss.
The C-market spike, the Brazil frost news, and the hedge call on my calendar at 15:00 sit on the same row at the bottom. The dashboard doesn’t analyze. It just puts them side by side. That’s enough.
This is the thing AI does that I couldn’t ask a Chief of Staff to do reliably. It cross-references across formats.
Every tile is a question
The first version was a printout. I taped it next to my monitor.
By day three I was annotating it with a pen. “Why is the C-market up?” “Which contracts expire?” “What’s the deal with Sightglass?”
That’s the whole point of making it an artifact instead of a PDF.
Every tile is clickable. Click the C-market tile and it hands you the exact question — “Walk me through the hedge decision: should I extend cover through Q3 and Q4?” Drop it into the project chat and Claude answers in two sentences, from the same files the tile was built on. Click an action and you get “What’s the trigger, what’s the trade-off?”
Below the dashboard sits a row of suggested prompts: What should I focus on today? Which customers are at risk? Summarize the hedge decision.
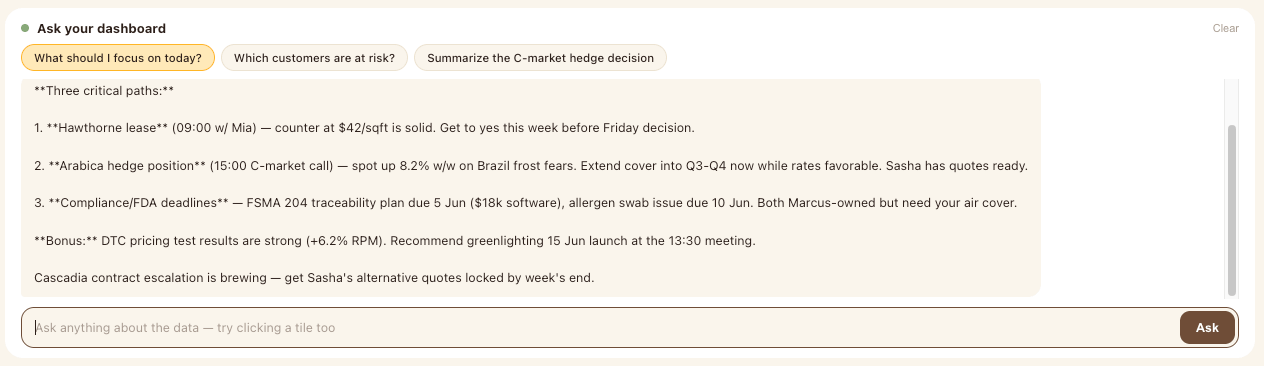
You ask. Claude answers. Then you ask the follow-up. The project remembers the thread between sessions.
The dashboard stopped being a report and became the morning briefing. Except the briefer never gets tired of follow-up questions.
This is the part that flipped how I use it. I used to look at a dashboard and form opinions in my head. Now I click the thing that doesn’t make sense and let Claude walk me through it. The cognitive load drops by about half.
What I changed after the first run
Two things:
First, the action check questions were too generic. “Status?” with three options. I rewrote the instructions so each question carries the trigger: “Cupping showed Konga at 87.2 versus Worka at 86.9. Status?” Now the decision is pre-loaded into the question. I’m not remembering. I’m reacting.
Second, I told Claude to flag any decision where I’d gone silent for more than 48 hours. That became a coral pill on aged actions. Old decisions surface on their own now.
What this costs
Zero extra. The demo files are free. Cowork runs inside the Claude desktop app on the paid plan you already have. The dashboard renders in one prompt.
The cost is the 15 minutes to set it up.
The value is the 90 minutes a day you spend reading things into your head that an AI can hold for you.
What I’d build next
A version that pulls live from Gmail, Otter.ai, QuickBooks, and the Square POS instead of static files. That’s a connector job, not a file job — same workflow once the data lands.
A version that runs at 06:00 on a schedule and waits for me with the action questions ready. Cowork already does this — type /schedule in the task.
A version that knows my travel calendar and shifts focus to the cafe I’m visiting that week.
All of these get 10x easier once the demo works. So start with the demo.
Try it
Try the demo:
Create a Cowork project.
Add the files.
Paste the instructions.
Run the action check.
Build the dashboard.
Then tell me: what did it surface that you didn’t already know?
That’s the test. If a one-page dashboard built from your own files surprises you on day one, you’ve found the gap your week was hiding from you.
And that’s all for today.
Whenever you’re ready, here’s how to get more:
Subscribe to AI COO Office — every week, one story on how AI is reshaping the COO role.
Forward this to one COO who needs to read it.
I’m Joost Vogelezang. Executive leader, COO and Co-founder at finstory.ai